-
Contributor

- News of the day
-
TBA
- Background
-
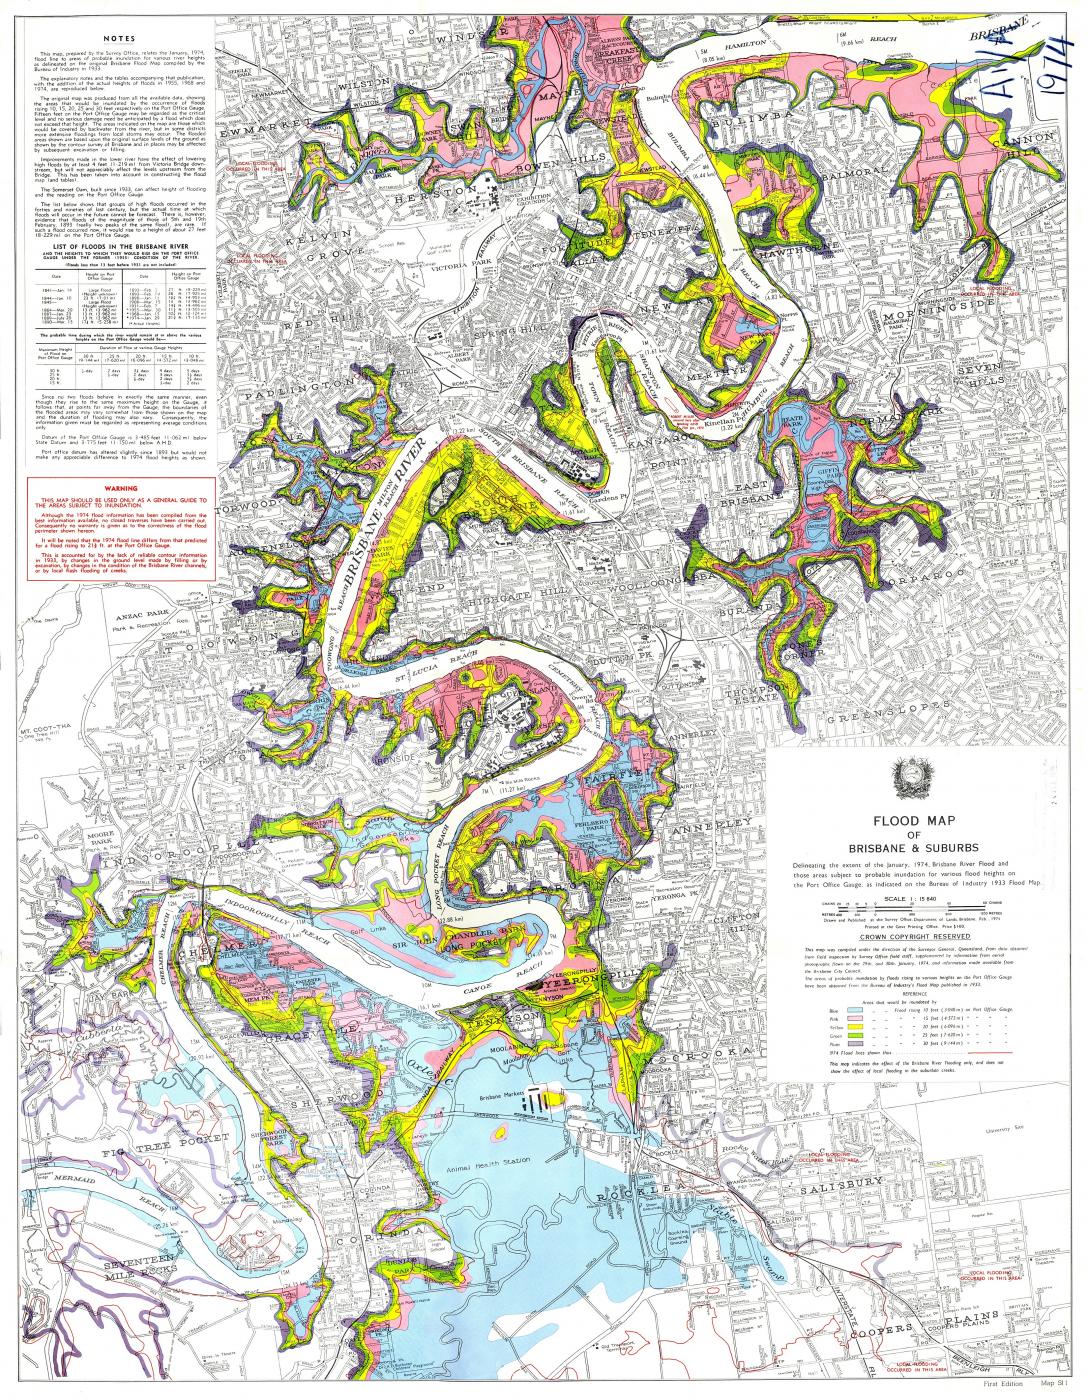
This map, prepared by the Survey Office, relates to the January, 1974, flood line to areas of probable inundation for various river heights as delineated on the original Brisbane Flood Map compiled by the Bureau of industry in 1933.
The original map was produced from all the available data, showing the areas that would be inundated by the occurrence of floods rising 10, 15, 20, 25 and 30 feet respectively on the Port Office Gauge. Fifteen feet on the Port Office Gauge may be regarded as the critical level and no serious damage need be anticipated by a flood which does not exceed that height. The areas indicated on the map are those which would be covered by backwater from the river, but in some districts more extensive floodings from local storms may occur. The flooded areas shown are based upon the original surface levels of the ground as shown by the contour survey of Brisbane and in places may be affected by subsequent excavation or filling.